Improving our Coasts with High-Resolution Land Cover Data
The Takeaway: High-resolution land cover data is now available through NOAA’s Digital Coast. This data provides communities with the foundational data needed to assess coastal resources, analyze land use, prepare for disaster risks, and adapt to a changing climate.
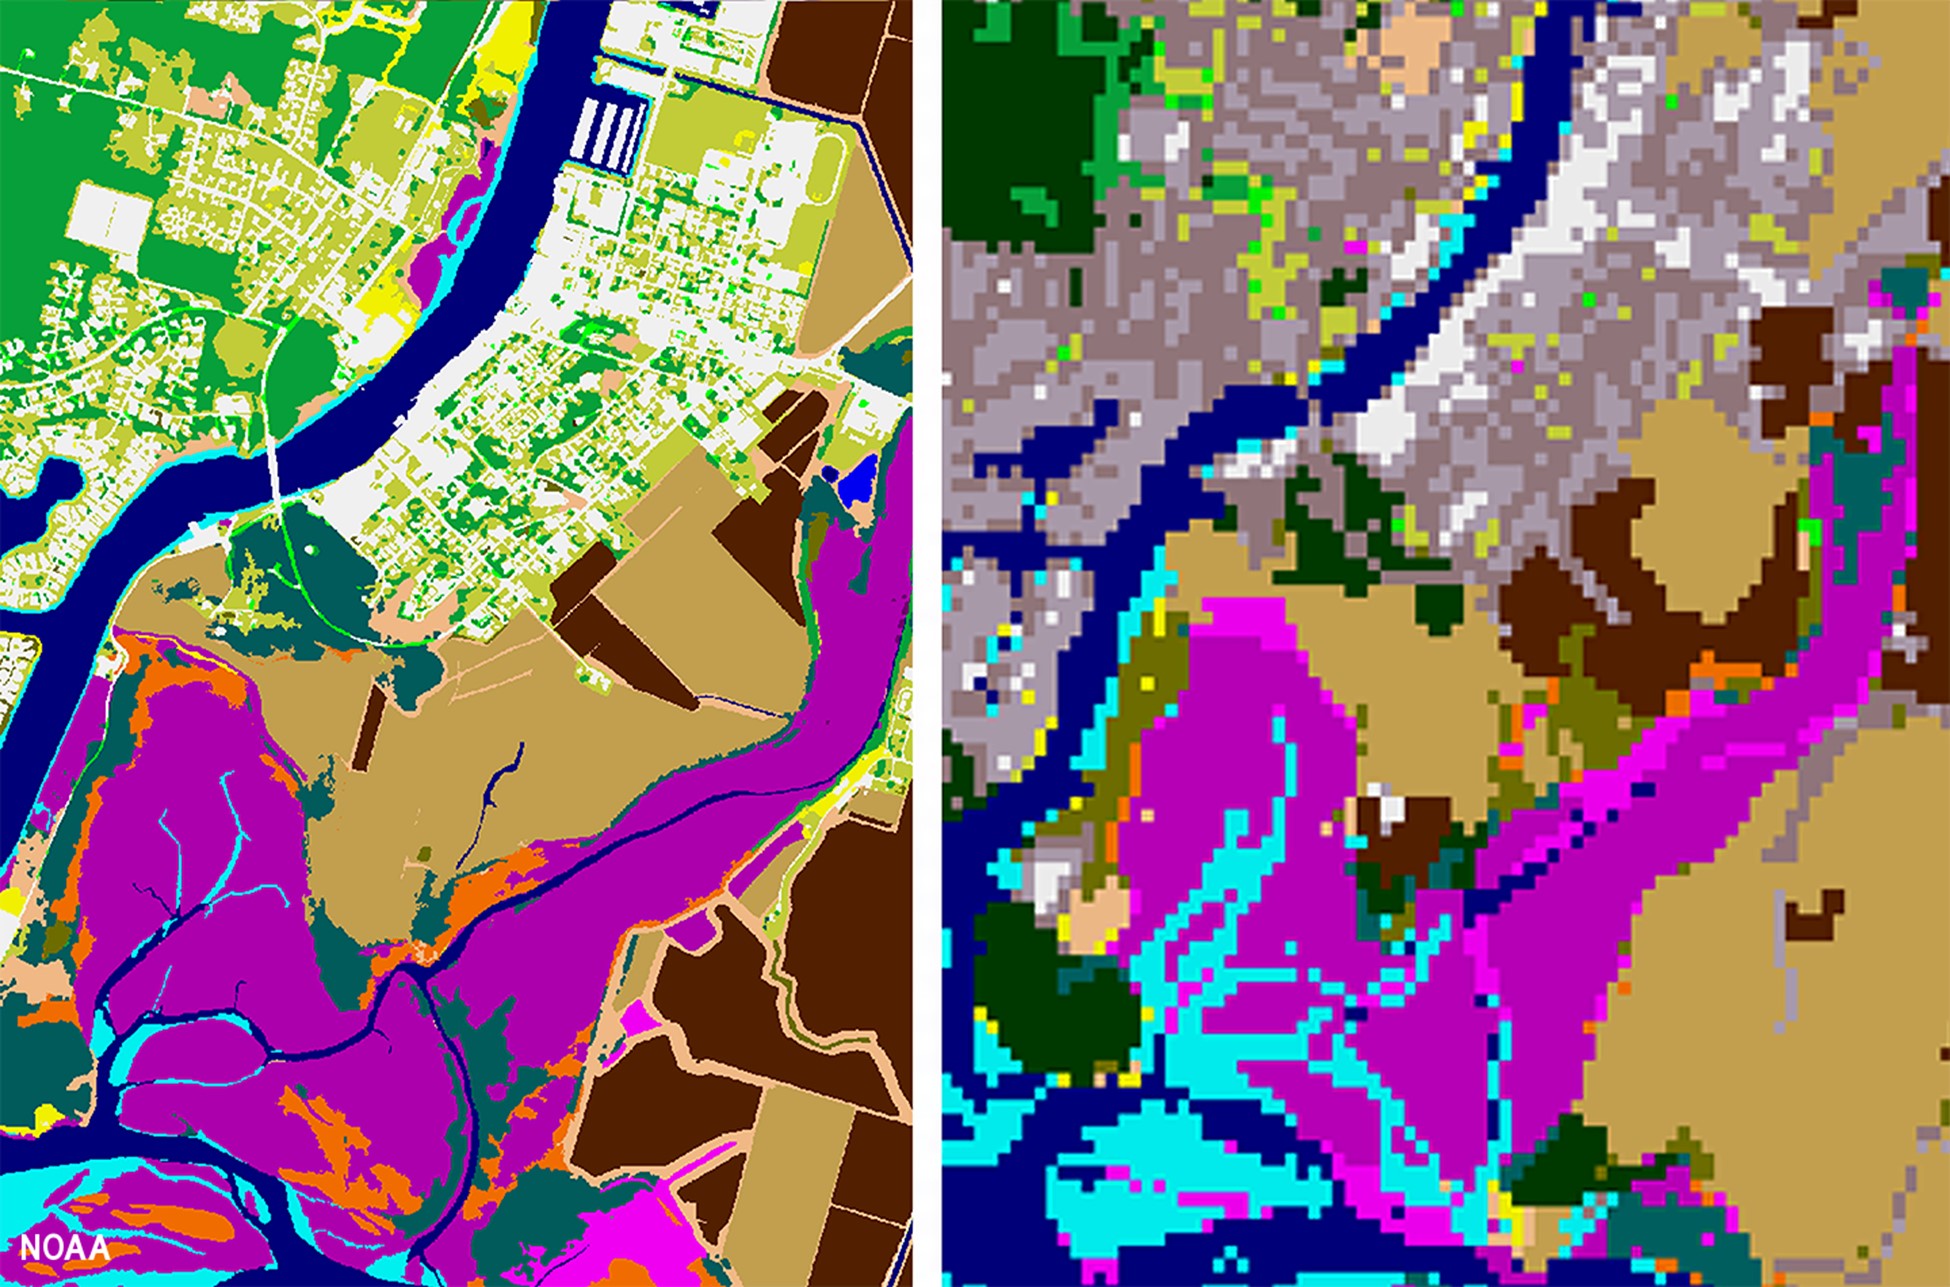
Land cover is a foundational data set that provides valuable information for a range of applications, including natural resource management, land use planning, disaster risk reduction, and climate adaptation. By comparing one year to another, people also use the information to document how the landscape has changed over time.
NOAA, in conjunction with several partners, released a high-resolution version of this data product, moving from 30-meter resolution to 1-meter. (The new data product is 900 times more detailed than the previous generation of land cover maps!) The coverage expanded, too. All of the coastal and Great Lakes states are mapped, as well as the territories, and, for the first time, Alaska.
This higher level of resolution means new data users, as the new data product can be used on a site or local level. Here are some examples.
Flood Inundation Modeling and Risk Assessment
High-resolution land cover data helps modelers more accurately simulate how water will flow across the landscape, find areas that are flood-prone, and identify at-risk features, including buildings, roads, and bridges.
- Improved Storm Surge Modeling. Land cover data is a key input for the National Weather Service’s “SLOSH” model, which estimates storm surge heights. The higher the resolution of the input data, the more accurate the model, which is particularly important in smaller island geographies. Puerto Rico and the U.S. Virgin Islands, for instance, are benefiting greatly from the inclusion of high-resolution data.
- Identifying Flood Risks to Transportation Infrastructure. In Texas, high-resolution land cover data was integrated with flood modeling layers. This effort made it possible to analyze bridges under a variety of flood scenarios, and several were identified as potentially at risk from future flooding scenarios.
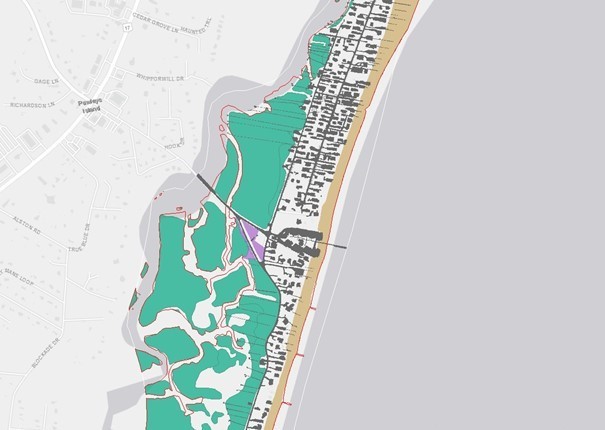
- Lowering Community Flood Insurance Costs. The Town of Pawleys Island, South Carolina, used high-resolution land cover data to map open space in the floodplain and calculate the amount of credits the community could earn through the open space preservation activity in FEMA’s Community Rating System program. That work helped the town advance to the next level in the program, which gave home and business owners in the community a 25 percent discount on flood insurance premiums.
Stormwater Management and Water Quality Protection
High-resolution land cover data improves a community’s ability to identify sources of pollution and estimate pollutant amounts, including erosion sediments. Officials also use this information to better understand where pollutants and sediments might end up and how this issue could impact drinking water and coastal habitats.
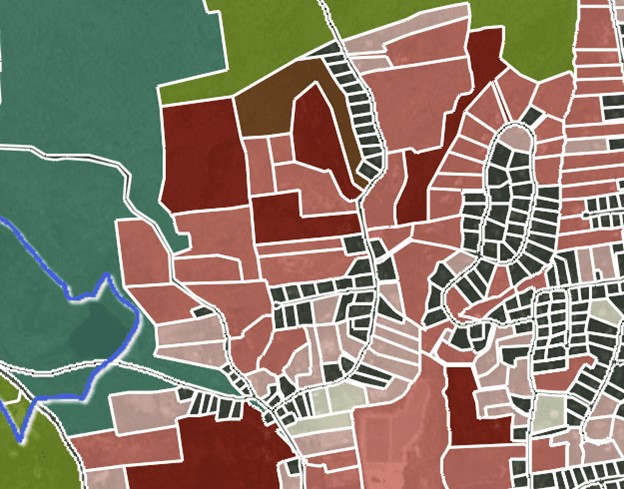
- Stormwater Utility Fees. The City of Jacksonville, Florida, is using high-resolution land cover data to map more than 350,000 parcels in Duval County. The map is helping the Department of Public Works more accurately assess pervious and impervious areas on private properties, and use this information to determine landowner obligations under the city’s impervious area charge program.
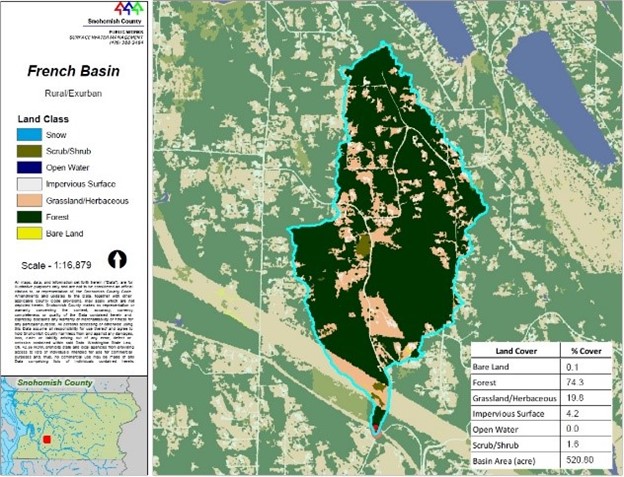
- Assessing a Stream’s Environmental Health. High-resolution land cover was used in Snohomish County, Washington, to determine land cover types within stream buffers and sub-basins. The information is used to develop stream health reports, which the county uses to focus the resources needed to protect healthy waters and improve impaired bodies of water. The data is also used to develop stormwater runoff models.
- Identify Drinking Water Sources and Water Health. In Connecticut, high-resolution land cover was used, statewide, to identify, prioritize, and protect drinking water sources. Land cover data was used to identify parcels with high amounts of impervious surface and turf (which can degrade water quality) and undeveloped parcels (which can help ensure water quality). The analysis would have been impossible without this detailed information resource.
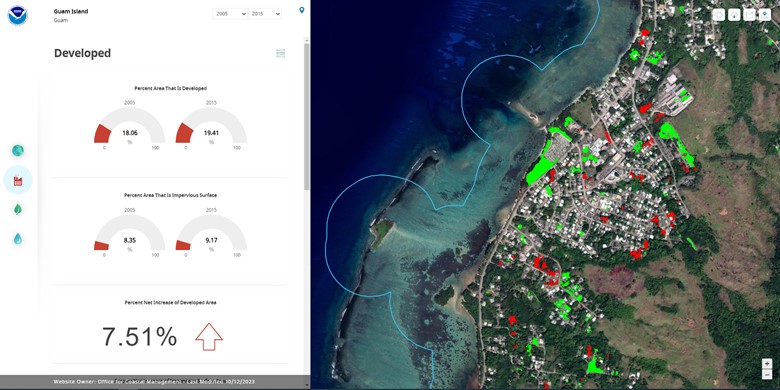
- Balance Development and Environmental Protection. The Guam Coastal Management Program uses high-resolution land cover data to recommend ways to lessen watershed stressors that various development projects may cause.
Heat Risk, Urban Forestry, and Tree Equity
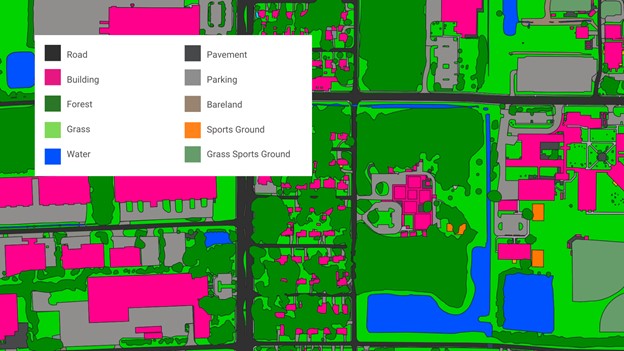
High-resolution land cover data can be used to identify areas within urban areas that are particularly hot, such as asphalt parking lots, buildings with dark roofs or facades, and areas with sparse vegetation. The data can also be used to identify areas that have tree canopy, and areas where tree planting could help mitigate heat impacts.
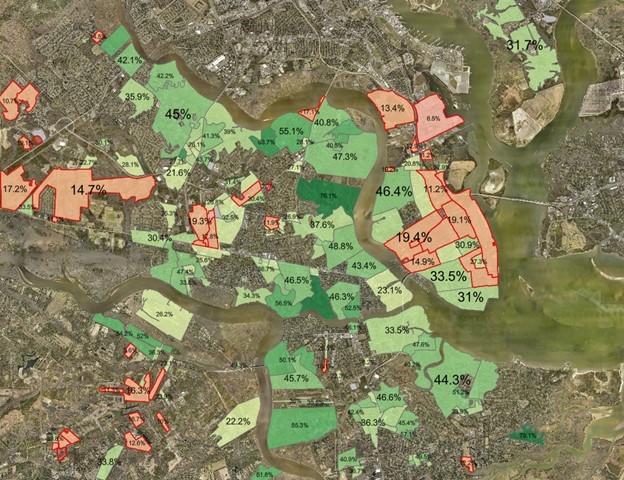
- Mitigating Urban Heat Risks and Promoting Tree Equity. As part of a NOAA heat study grant, Charleston, South Carolina, officials used the high-resolution data to determine which subdivisions were experiencing unusually high impacts from heat. They then analyzed areas available for tree plantings in public housing properties. These trees will help mitigate heat risk and improve the green space within these neighborhoods.
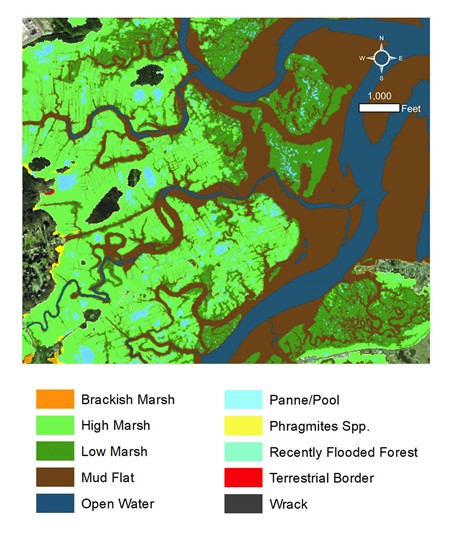
Wetland Monitoring, Conservation, or Restoration Planning
High-resolution land cover can capture landscape conditions, including wetlands. The level of detail available from high-resolution data can improve monitoring efforts, increase one’s understanding of how the landscape can impact wetlands and other important features, analyze carbon stocks, and evaluate the best places for management actions, including adaptation measures taken to address future sea level rise.
- Marsh Resilience and Comprehensive Management. High-resolution wetland mapping in New Hampshire was used to evaluate current conditions and the future resilience of salt marshes. This information was used to pinpoint, marsh-by-marsh, where restoration, experimental science, land conservation, and land use planning could be most effective. This resulted in the New Hampshire Salt Marsh Plan.
- Documenting Air Pollution Impacts. Using high-resolution land cover and land cover change data, scientists were able to document higher carbon dioxide and methane emissions in soils and waters near mangrove forests that were near densely urbanized areas. This information is being used to determine the effects of urbanization on mangrove systems and their ability to sequester carbon.
Additional Examples
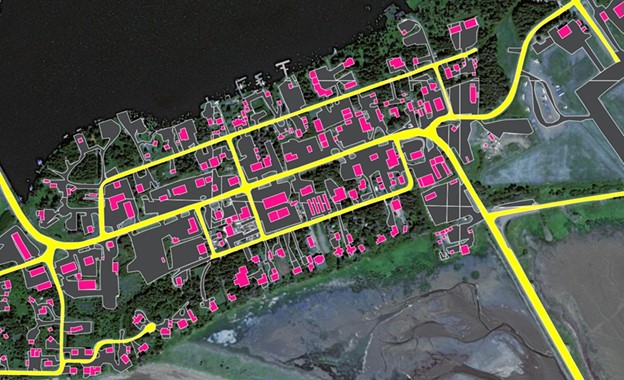
- Discovering Gaps in Broadband Access. Alaska used high-resolution land cover to map buildings and internet coverage. This documentation is boosting the likelihood that government funding can be used to help provide services to those areas currently without broadband access.
- Assessing Equitable Water Use. California’s urban residential landscape was mapped and the data was combined with a software system that enables water suppliers to identify and target inefficient water users. This information is strengthening state enforcement of water-efficiency laws, aiding local drought resilience and drought planning, and documenting agricultural water-use efficiency.
Partners: NOAA Office for Coastal Management, Ecopia, NV5
PRINT